Visualization Layer
The module of the VTS serves to format the data output generated by the solver, analysis, and optimization layers for easy visualization. In general, three classes of data will be displayed by this module:
- (a) solver and analysis results related spatial, temporal, spectral, and/or angular distributions of the optical field within the tissue;
- (b) solver and analysis results related to spatial, temporal, and/or spectral distributions of transmitted/optical signals from the tissue;
- (c) optimization results related to the solution of inverse problems, i.e., determination of optical properties or optimal measurement/instrument configurations.
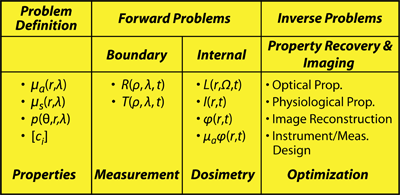
A graphical representation of the Solver Layer is shown below: